SATA Dividend Calculator
Estimate your SATA monthly income and tax-equivalent yield.
| Year | Cumulative Received | Remaining Basis ⓘ | Monthly Tax Owed ⓘ | Status ⓘ |
|---|---|---|---|---|
| 1 | $13,000 | $87,000 | — | deferred |
| 2 | $26,000 | $74,000 | — | deferred |
| 3 | $39,000 | $61,000 | — | deferred |
| 4 | $52,000 | $48,000 | — | deferred |
| 5 | $65,000 | $35,000 | — | deferred |
| 6 | $78,000 | $22,000 | — | deferred |
| 7 | $91,000 | $9,000 | — | deferred |
| 8 | $104,000 | $0 | $162.50 | taxable |
| 9 | $117,000 | $0 | $162.50 | taxable |
| 10 | $130,000 | $0 | $162.50 | taxable |
| 11 | $143,000 | $0 | $162.50 | taxable |
| 12 | $156,000 | $0 | $162.50 | taxable |
| 13 | $169,000 | $0 | $162.50 | taxable |
| 14 | $182,000 | $0 | $162.50 | taxable |
| 15 | $195,000 | $0 | $162.50 | taxable |
What Is SATA?
SATA — Strive's Variable Rate Series A Perpetual Preferred Stock — is a publicly traded preferred stock issued by Strive, Inc. (Nasdaq: ASST). It trades on Nasdaq near a $100 par value and pays a daily cash dividend (every business day, as of June 2026), currently set at a 13% annual rate. Learn more about what SATA is and how it works.
Strive uses the capital raised from selling SATA shares to buy Bitcoin for its corporate treasury. Like Strategy's STRC, the dividend rate adjusts to keep the share price anchored around $100:
How Does SATA Compare to STRC?
SATA and STRC are structurally almost identical — both are variable-rate perpetual preferred stocks backed by Bitcoin treasuries, paying cash dividends classified as return of capital. SATA now pays daily (every business day) while STRC remains monthly. The other key differences are scale, liquidity, and yield:
Some investors hold both SATA and STRC to diversify single-issuer risk while increasing overall portfolio yield.
How Are SATA Dividends Taxed?
Like STRC, SATA dividends are classified as return of capital (ROC) for US tax purposes. You don't owe income tax when you receive them — each payment reduces your cost basis in the shares.
Once your basis reaches $0, subsequent dividends become taxable at your long-term capital gains rate rather than ordinary income rates. This deferred treatment makes the tax-equivalent yield significantly higher than the stated rate:
For an investor in a 15% capital gains bracket, a 13% SATA yield is equivalent to earning 15.3% from a fully taxable investment. The ROC classification is determined year by year based on Strive's earnings and profits position.
Where Does the Yield Come From?
Bitcoin generates no cash flow on its own. The 13% yield is funded from two primary sources:
SATA sits senior to Strive's common stock (ASST) in the capital stack but junior to any future debt. Strive has retired all remaining debt and now operates a preferred-equity-only balance sheet. The structure works as long as Bitcoin appreciates faster than the 13% annual cost and capital markets remain open for new issuance.
SATA is available on most major brokerages. See our guide on where to buy SATA for a full broker comparison.
This calculator is for informational and educational purposes only and does not constitute financial, investment, or tax advice. SATA is not a bank deposit, not FDIC insured, and carries risk of loss. Past performance is not indicative of future results. Always consult a qualified financial advisor before making investment decisions.
Featured Bitcoin Charts
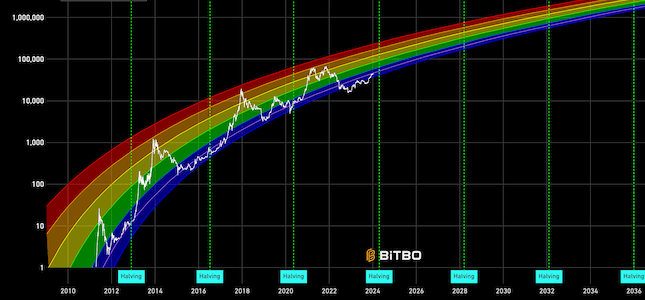
Original Rainbow Chart
The original Bitcoin rainbow price chart showing logarithmic regression bands.
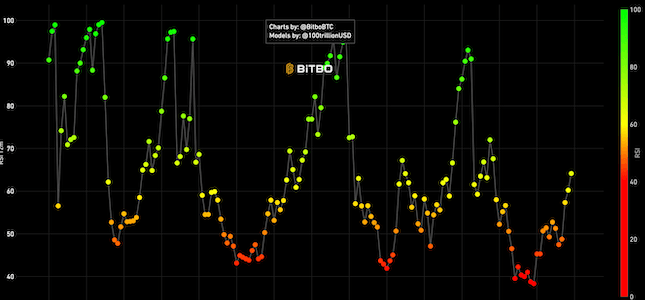
RSI
The Relative Strength Index (RSI) is a momentum based visualization.
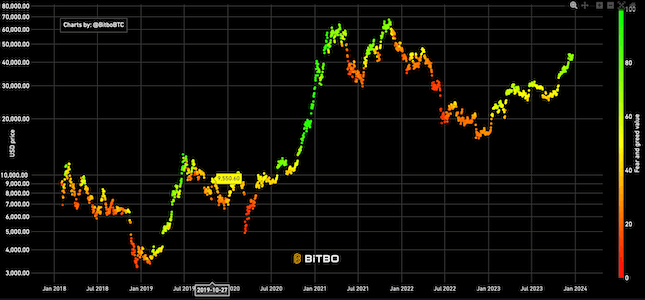
Bitcoin Fear and Greed Index
Sentiment analysis for Bitcoin & crypto markets, indicating when markets are overly fearful or greedy.
