Disclaimer: Nothing here should be interpreted as altcoin promotion. We focus exclusively on BTC.
Bitcoin vs Pi Network (PI)
PI Live Price (BTC)₿0.000001
Price in USD
$0.08
Market Cap (USD)
4.72
B
Market Cap (BTC)
73,015
Sats per Coin
127
PI / BTC Converter
⇄
=
$0.08
CAGR Comparison
Compound Annual Growth Rate (CAGR) shows the average yearly return over different time periods.
Select a period to see the annualized return (CAGR) for each asset over that timeframe.
BTC-24.48%
PI-80.97%
2025-02-20 → 2026-07-26
Returns Comparison
| Timeframe | PI | BTC |
|---|---|---|
| 5 Day | -11.64% | -2.62% |
| 1 Month | -35.65% | +7.46% |
| 3 Month | -55.38% | -16.32% |
| 6 Month | -53.75% | -27.67% |
| YTD | -60.35% | -26.21% |
DCA Comparison
Bitcoin
Return:
-29.59%
Total Value:
$3,027.61
Total Invested:
$4,300.00
Profit/Loss:
$-1,272.39
Pi Network
Return:
-81.25%
Total Value:
$806.36
Total Invested:
$4,300.00
Profit/Loss:
$-3,493.64
Historical Performance Comparison
Featured Bitcoin Charts

Bitcoin Fear and Greed Index
Sentiment analysis for Bitcoin & crypto markets, indicating when markets are overly fearful or greedy.
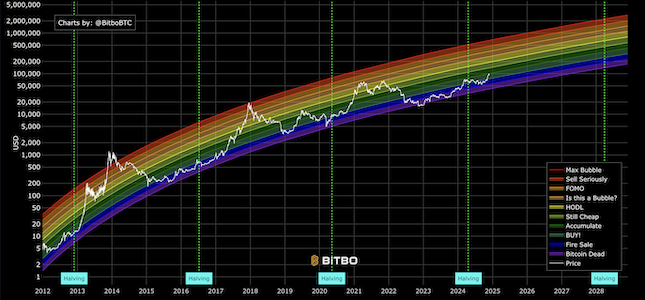
Original Rainbow Chart
The original Bitcoin rainbow price chart showing logarithmic regression bands.

Bitcoin Price Predictions
Shows 4 Bitcoin price models: power law, stock to flow, stock to income, and HPR Rainbow.