Disclaimer: Nothing here should be interpreted as altcoin promotion. We focus exclusively on BTC.
Bitcoin vs Lombard Staked BTC (LBTC)
LBTC Live Price (BTC)₿1.001281
Price in USD
$64,622.95
Market Cap (USD)
1.74
B
Market Cap (BTC)
27,010
Sats per Coin
100,128,144
LBTC / BTC Converter
⇄
=
$64,622.95
CAGR Comparison
Compound Annual Growth Rate (CAGR) shows the average yearly return over different time periods.
Select a period to see the annualized return (CAGR) for each asset over that timeframe.
BTC+4.87%
LBTC+4.54%
2024-08-29 → 2026-07-18
Returns Comparison
| Timeframe | LBTC | BTC |
|---|---|---|
| 5 Day | +3.29% | +3.95% |
| 1 Month | +0.49% | +0.54% |
| 3 Month | -12.83% | -12.66% |
| 6 Month | -30.30% | -30.35% |
| YTD | -26.39% | -26.38% |
DCA Comparison
Bitcoin
Return:
-7.63%
Total Value:
$3,971.93
Total Invested:
$4,300.00
Profit/Loss:
$-328.07
Lombard Staked BTC
Return:
-7.89%
Total Value:
$3,960.93
Total Invested:
$4,300.00
Profit/Loss:
$-339.07
Historical Performance Comparison
Featured Bitcoin Charts
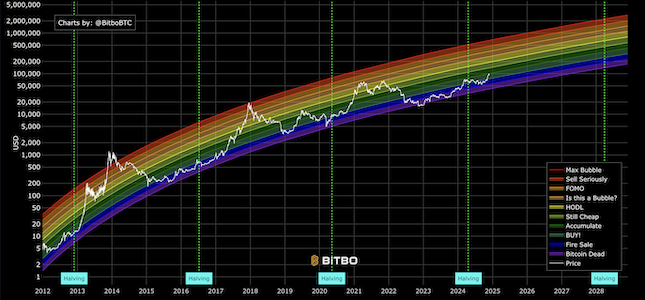
Original Rainbow Chart
The original Bitcoin rainbow price chart showing logarithmic regression bands.

RSI
The Relative Strength Index (RSI) is a momentum based visualization.
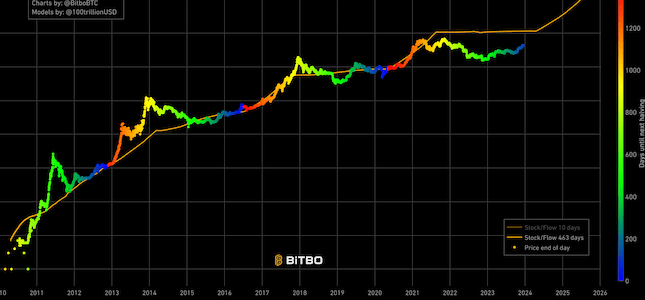
Stock to Flow
Shows the projected Bitcoin price based on the stock to flow model.