Exxon Mobil Corporation (XOM)
XOM Live Price (BTC)₿0.002184
Price in USD
$156.12
Market Cap (USD)
650.51
B
Market Cap (BTC)
9,100,799
Sats per Share
218,414
CAGR Comparison
Compound Annual Growth Rate (CAGR) shows the average yearly return over different time periods.
Returns Comparison
| Timeframe | XOM | BTC |
|---|---|---|
| 5 Day | +3.25% | +4.14% |
| 1 Month | +0.36% | +5.80% |
| 3 Month | +31.39% | -21.43% |
| 6 Month | +39.19% | -38.92% |
| YTD | +29.04% | -19.77% |
DCA Comparison
Bitcoin
Return: +46.23%
Total Value: $5,703.00
Total Invested: $3,900.00
Profit/Loss: $1,803.00
Exxon Mobil Corporation
Return: +38.67%
Total Value: $5,408.20
Total Invested: $3,900.00
Profit/Loss: $1,508.20
Historical Performance Comparison
Featured Bitcoin Charts
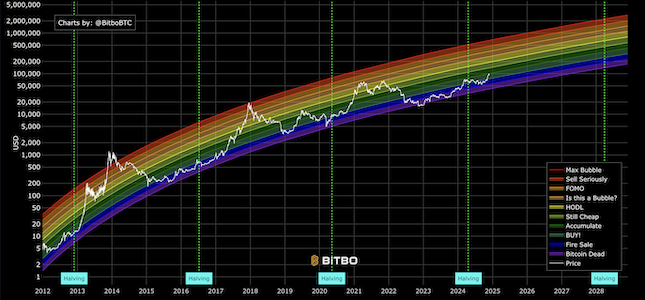
Original Rainbow Chart
The original Bitcoin rainbow price chart showing logarithmic regression bands.

Bitcoin Price Predictions
Four price models: power law, stock to flow, stock to income, HPR Rainbow.
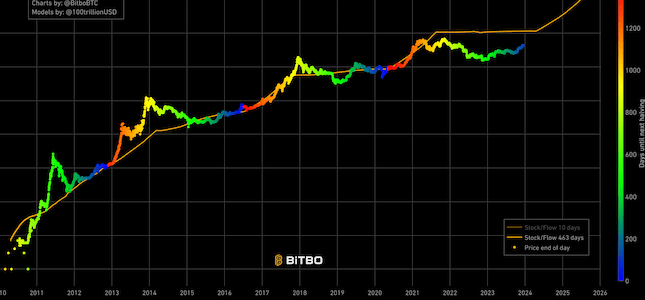
Stock to Flow
Shows the projected Bitcoin price based on the stock to flow model.