SR vs BTC
Spire Inc.
Price in BTC₿0.001145
Price in USD
$88.91
Market Cap (USD)
5.35
B
Market Cap (BTC)
69,013
Sats per Share
114,513
Cumulative Returns
Returns are calculated from the beginning of the selected time period. Use the range buttons above the chart to compare performance over different timeframes.
Apr 24, 2023 → Apr 22, 2026
CAGR Comparison
Compound Annual Growth Rate (CAGR) shows the average yearly return over different time periods.
Returns Comparison
| Timeframe | SR | BTC |
|---|---|---|
| 5 Day | -3.68% | +1.47% |
| 1 Month | -1.67% | +10.37% |
| 3 Month | +5.78% | -12.56% |
| 6 Month | +0.01% | -29.55% |
| YTD | +7.51% | -10.60% |
DCA Comparison
Bitcoin
Return
+60.13%
Total Value
$6,405.33
Total Invested
$4,000.00
Profit/Loss
$2,405.33
Spire Inc.
Return
+28.77%
Total Value
$5,150.73
Total Invested
$4,000.00
Profit/Loss
$1,150.73
Historical Performance Comparison
Featured Bitcoin Charts
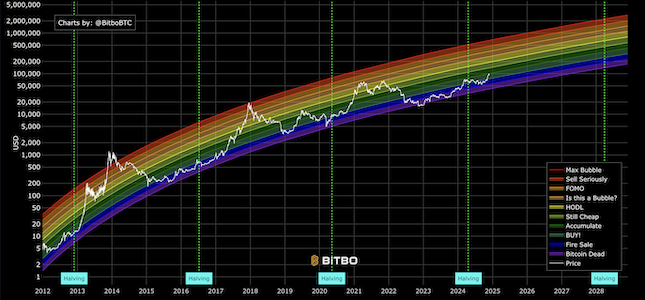
Original Rainbow Chart
The original Bitcoin rainbow price chart showing logarithmic regression bands.

Bitcoin Price Predictions
Four price models: power law, stock to flow, stock to income, HPR Rainbow.
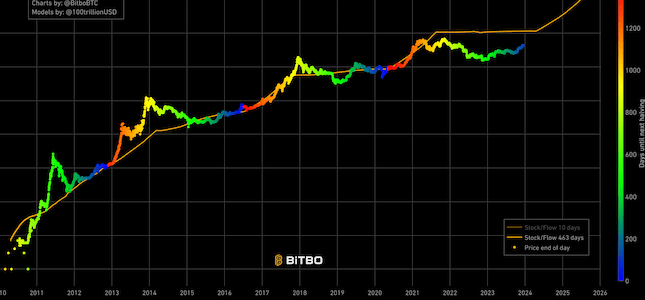
Stock to Flow
Shows the projected Bitcoin price based on the stock to flow model.