Pearson, Plc (PSO)
PSO Live Price (BTC)₿0.000121
Price in USD
$14.50
Market Cap (USD)
9.38
B
Market Cap (BTC)
78,397
Sats per Share
12,115
CAGR Comparison
Compound Annual Growth Rate (CAGR) shows the average yearly return over different time periods.
Returns Comparison
| Timeframe | PSO | BTC |
|---|---|---|
| 5 Day | +0.28% | +3.20% |
| 1 Month | +1.12% | +0.94% |
| 3 Month | -8.63% | +13.99% |
| 6 Month | -13.54% | +21.28% |
| YTD | -10.05% | +26.40% |
DCA Comparison
Bitcoin
Return: +169.80%
Total Value: $8,633.53
Total Invested: $3,200.00
Profit/Loss: $5,433.53
Pearson plc
Return: +14.36%
Total Value: $3,659.36
Total Invested: $3,200.00
Profit/Loss: $459.36
Historical Performance Comparison
Featured Bitcoin Charts

RSI
The Relative Strength Index (RSI) is a momentum based visualization.

Bitcoin Fear and Greed Index
Sentiment analysis for Bitcoin & crypto markets, indicating when markets are overly fearful or greedy.
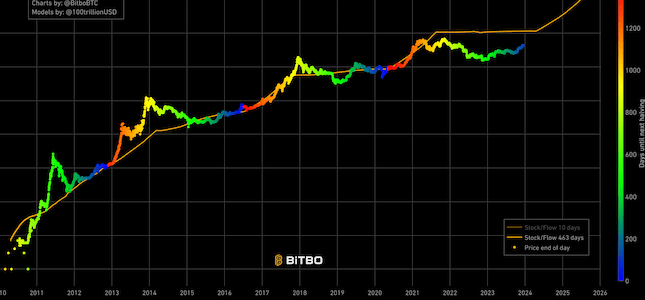
Stock to Flow
Shows the projected Bitcoin price based on the stock to flow model.