Citigroup, Inc. (C)
C Live Price (BTC)₿0.000887
Price in USD
$96.57
Market Cap (USD)
177.77
B
Market Cap (BTC)
1,632,769
Sats per Share
88,694
CAGR Comparison
Compound Annual Growth Rate (CAGR) shows the average yearly return over different time periods.
Returns Comparison
| Timeframe | C | BTC |
|---|---|---|
| 5 Day | +1.38% | -7.29% |
| 1 Month | +0.79% | -8.01% |
| 3 Month | +28.21% | +4.19% |
| 6 Month | +20.79% | +28.57% |
| YTD | +37.19% | +15.43% |
DCA Comparison
Bitcoin
Return: +146.38%
Total Value: $7,884.26
Total Invested: $3,200.00
Profit/Loss: $4,684.26
Citigroup Inc.
Return: +70.22%
Total Value: $5,447.14
Total Invested: $3,200.00
Profit/Loss: $2,247.14
Historical Performance Comparison
Featured Bitcoin Charts

Bitcoin Fear and Greed Index
Sentiment analysis for Bitcoin & crypto markets, indicating when markets are overly fearful or greedy.
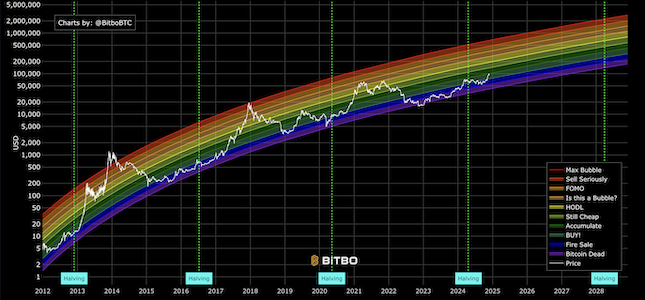
Original Rainbow Chart
The original Bitcoin rainbow price chart showing logarithmic regression bands.

Bitcoin Price Predictions
Four price models: power law, stock to flow, stock to income, HPR Rainbow.