Bitcoin circled $67,000 on Sunday as traders flagged hidden weakness in the market, with multiple signals pointing toward a potential breakdown rather than a breakout.
Bollinger Bands flash volatility warning
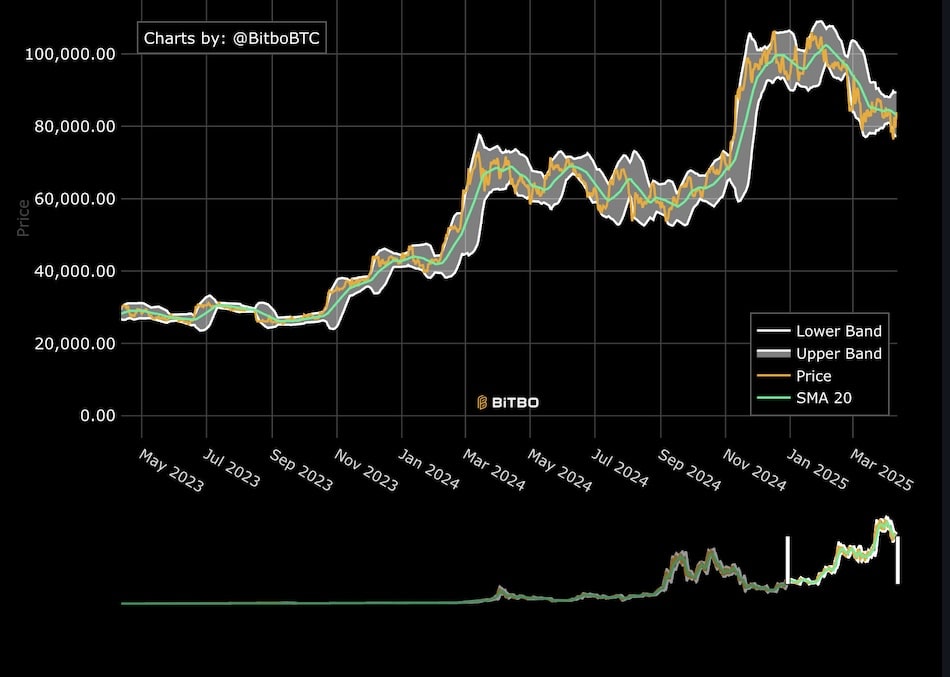
On four-hour time frames, the Bollinger Bands volatility indicator constricted sharply over the weekend — a classic signal that a sharp move in either direction is due, according to analysts.
Pseudonymous trader LP bet on the bears, pointing to the current cycle’s unusual behavior compared to historical patterns.
LP wrote:
“In contrast, this cycle has been doing the opposite, consistently sweeping the highs, making it difficult to enter short positions while leaving the lows exposed and building liquidity below.”
LP said sweeping local lows, including February’s wick below $60,000, was “likely just a matter of time.”
They added that if price begins repeatedly sweeping lows and making it psychologically difficult to enter longs, that’s when a true bottom is more likely forming.
Whales selling into flat price action
Keith Alan, cofounder of trading resource Material Indicators, flagged unusual selling activity despite flat bitcoin price action.
Uploading a chart of Binance order-book liquidity and volume by investor class, Alan highlighted a bot using a time-weighted average price (TWAP) strategy to distribute BTC on Friday.
Alan explained:
“The vertical orange line represents the smallest order class with a TWAP bot selling $18M in an hour. That’s exponentially more than their normal $3M-$5M daily volume in 1 hr. That ain’t retail!”
Whales, Alan added, were “buying dips and selling rips” with Bitcoin still trapped in a range.
Dollar strength adds to bearish pressure
The bearish technical picture is compounded by resurgent US dollar strength, which has historically weighed on bitcoin’s price.
The bitcoin fear and greed index and on-chain sentiment indicators will be closely watched in the coming days as traders brace for a potential resolution of the current tight range.