Bitcoin’s Mayer Multiple has slid to levels last seen during the 2022 bear market, as BTC trades about 45% below its $126,000 peak.
Mayer Multiple revisits 2022 oversold zone
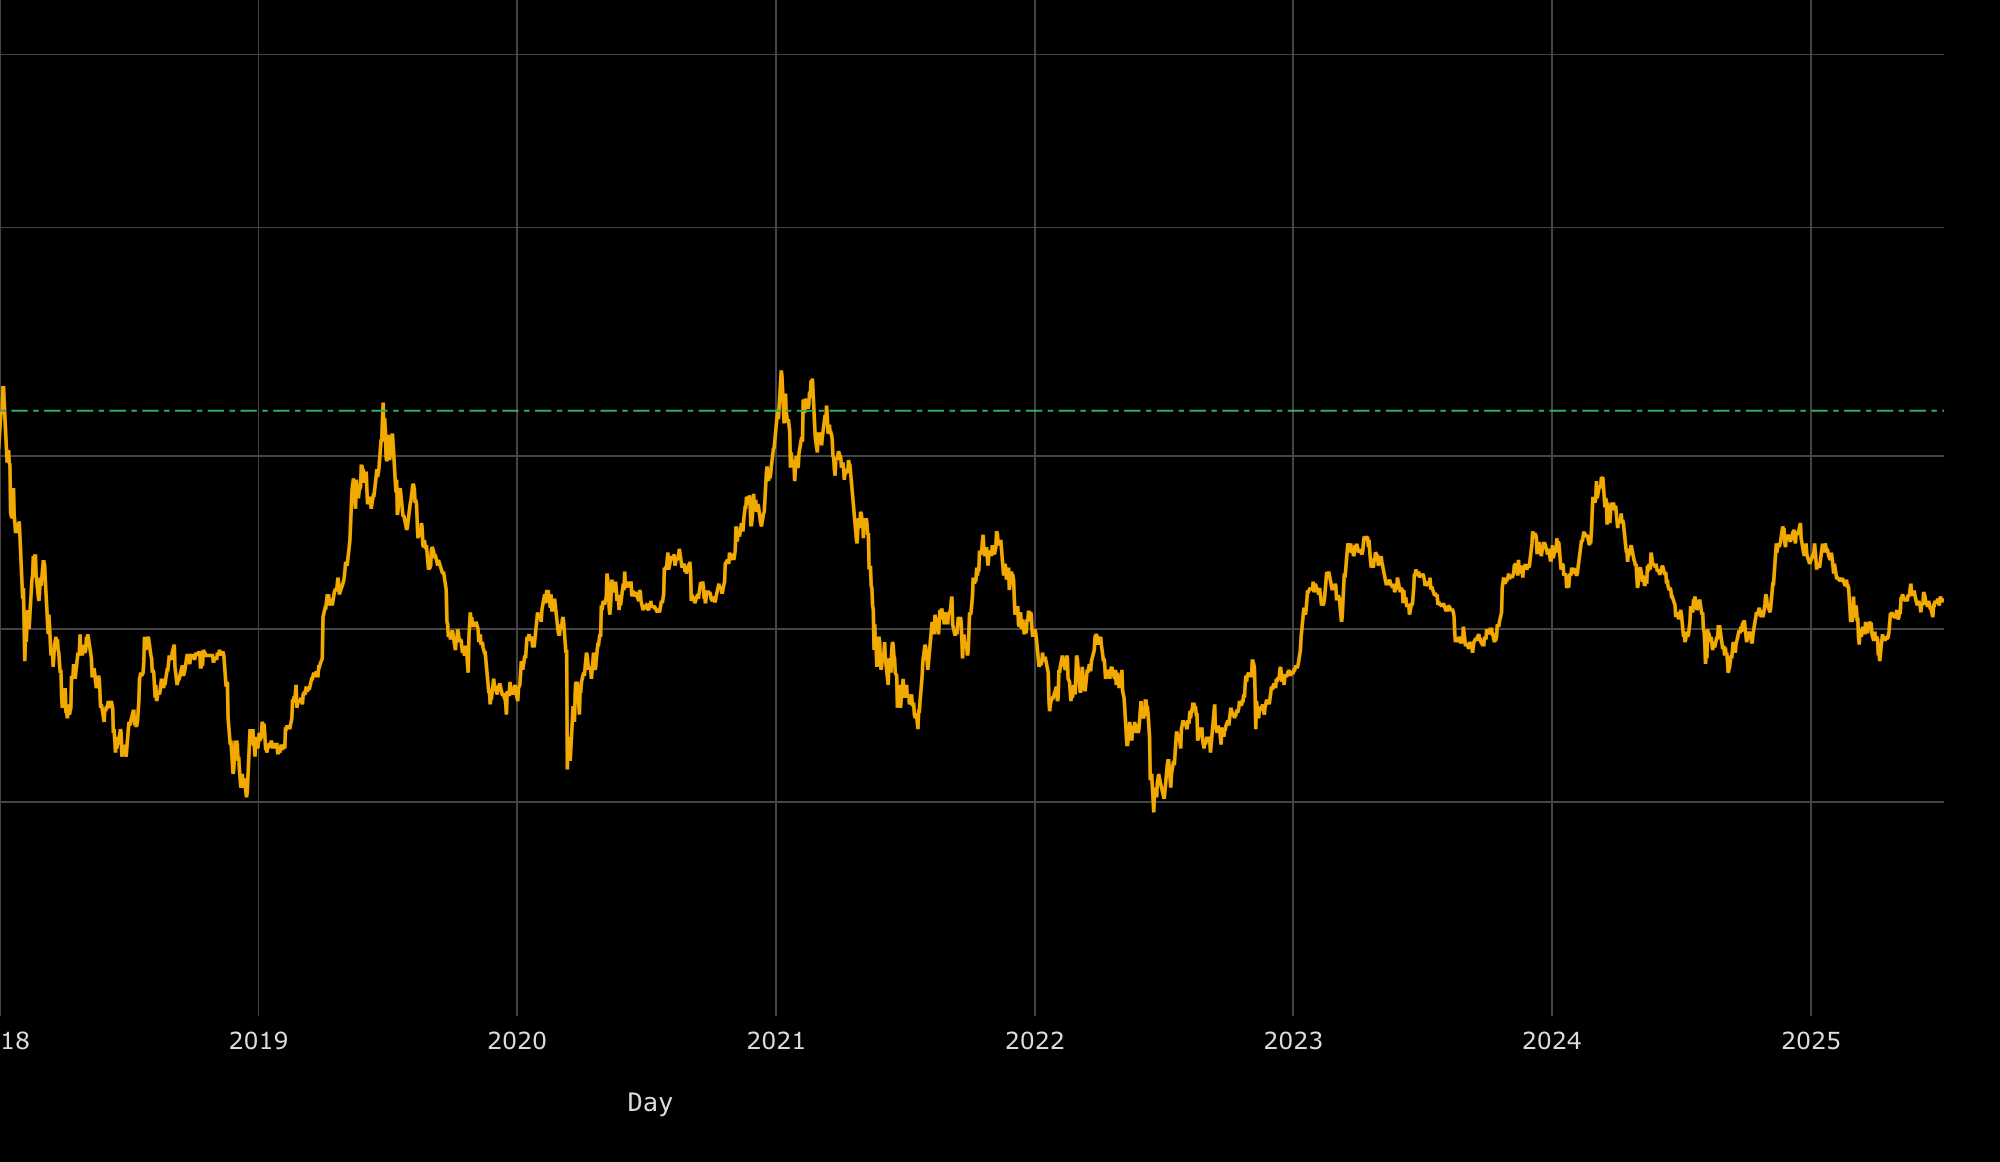
The Mayer Multiple compares Bitcoin’s spot price to its 200-day moving average.
A reading below 0.8 is typically considered “oversold,” and Glassnode data showed the metric at 0.65 as of Feb. 9.
The move puts the indicator near four-year lows and back into territory associated with deep bear markets, tracked on Bitbo’s Mayer multiple chart.
Analyst On-Chain College wrote on X:
“It can still take months before finding a bottom, but BTC is in a period in history typically reserved for the darkest days of bear markets.”
Capitulation comparisons and prior false floors
Commentators also pointed to how rare it is for Bitcoin to trade so far below its 200-day average.
In 2022, the Mayer Multiple later fell as low as roughly 0.47 before BTC ultimately bottomed months later near $15,500.
Support levels traders are watching
Another widely watched bear-market benchmark is the 200-week moving average, cited in the report at around $58,000.
That level is commonly treated as “ultimate support,” and can be followed via Bitbo’s 200-week moving average chart.
Analyst Jelle said RSI-based confluence put his focus on the low $50,000s, while an “extreme” scenario could imply a drop toward the $40,000 zone.