Key Takeaways
- John Bollinger says Bitcoin may be forming a classic double bottom near $80,000.
- The %b indicator suggests a potential reversal, but confirmation is still needed.
- Analysts say Bitcoin's recovery may depend on a Nasdaq rebound.
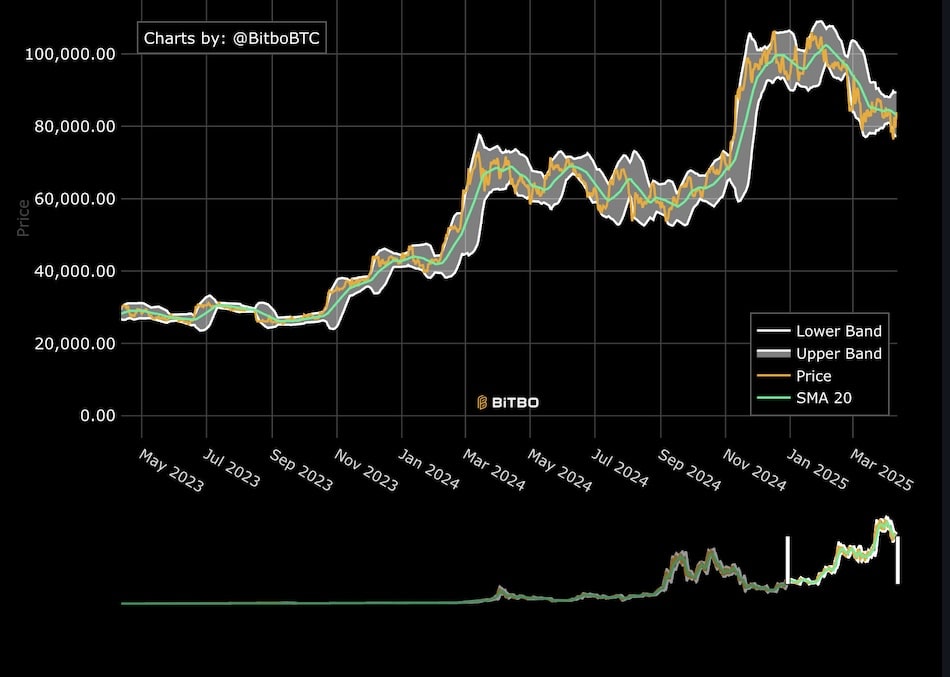
Bitcoin may be forming a long-term price floor near $80,000, according to John Bollinger, creator of the Bollinger Bands volatility indicator.
In an April 10 post on X, Bollinger pointed to a potential “classic” W-bottom structure using his proprietary %b metric.
He said:
Classic Bollinger Band W bottom setting up in $BTCUSD. Still needs confirmation.
The %b indicator measures closing prices in relation to Bollinger Band levels and can identify reversal patterns.
A confirmed W-bottom typically consists of a price dip below the lower band followed by a second, shallower dip—a structure Bitcoin appears to be mimicking on weekly charts.
Current chart data lacks trend shift confirmation
Despite this setup, both daily and weekly charts show that no confirmed trend reversal has occurred.
Bitcoin continues to track the lower Bollinger Band, with the 20-period simple moving average acting as resistance.
Cointelegraph data showed that the BTC/USD daily chart remains below trend, suggesting caution for bulls.
Stock market behavior mirrors Bitcoin setup
Jurrien Timmer, director of global macro at Fidelity, noted that similar dynamics are playing out in the S&P 500, which has dropped from 2 standard deviations above trend to nearly 2 below.
Meanwhile, economist Timothy Peterson suggested that a full Bitcoin reversal may only occur after the Nasdaq finds a bottom, projecting a further 10% drop in the tech-heavy index.