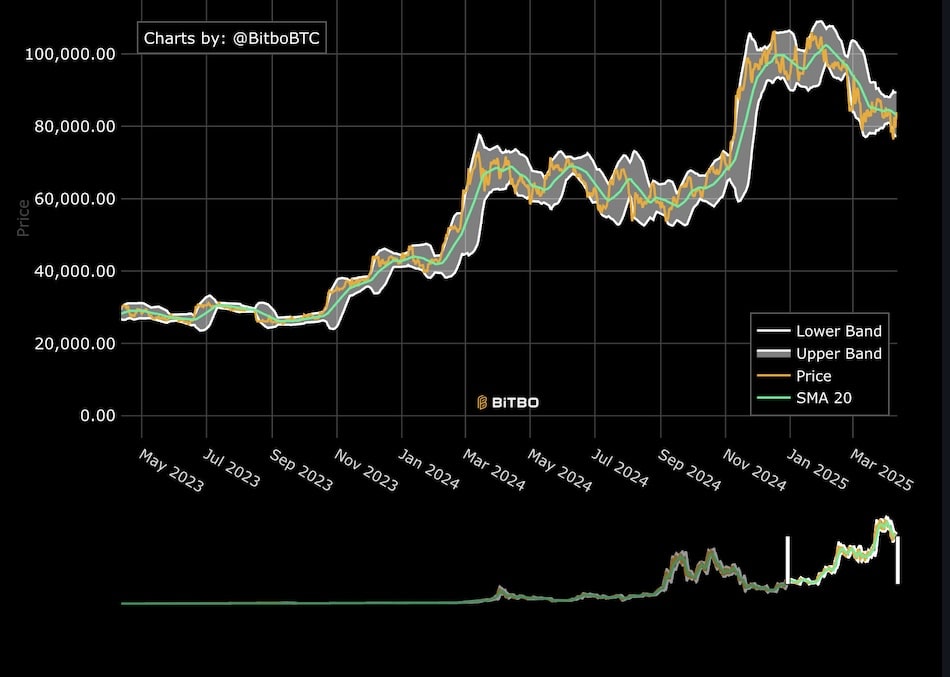
A widely followed technical indicator for Bitcoin, the Bollinger Bands, has reached its most extreme monthly tightness since the asset’s inception in 2009, signaling a potential for significant volatility.
Extreme compression observed
Trader Matthew Hyland highlighted that the Bollinger Bands are at their narrowest on the monthly chart, a phenomenon echoed by analyst Crypto Caesar, who stated:
“The Bitcoin Bollinger Bands on the 1M (monthly) are at historical tightness. This has previously led to heavy volatility to the upside. Bitcoin could be in for a spicy Q4.”
Historical episodes of such compression in 2012, 2016, and 2020 were followed by sharp upward price moves, as noted by investor Giannis Andreou, who warned of “huge volatility ahead.”
Cup-and-handle pattern points to $300K
Technical analysts are also watching a large cup-and-handle formation on the monthly chart, with the breakout neckline at $69,000 cleared in November 2024.
This classical chart pattern projects a price target of approximately $305,000 for Bitcoin in the 2025–2026 period, representing over 170% upside from current levels. H
owever, studies suggest only about 61% of such patterns reach their full target.
Institutional demand and ETF flows
Persistent demand from spot Bitcoin ETFs and public treasury companies is supporting bullish sentiment.
Recent inflows have accelerated, as noted by analytics firm Santiment:
“Money is moving back into Bitcoin ETFs at a rapid rate as retailers impatiently drop out of bitcoin. Previous bitcoin rallies were boosted by inflow spikes like this.”