Key Takeaways
- Bitcoin hit $104,000 on May 8 amid renewed interest in a 90-day lagged M2 chart.
- Global M2 began rising in February; traders view this as linked to Bitcoin's price move.
- Despite alignment over some periods, Bitcoin has outperformed M2 by 75% over the past year.
Bitcoin surged to $104,000 on May 8, and traders are once again eyeing the global M2 money supply chart—lagged by 90 days—as a potential guide to market movements.
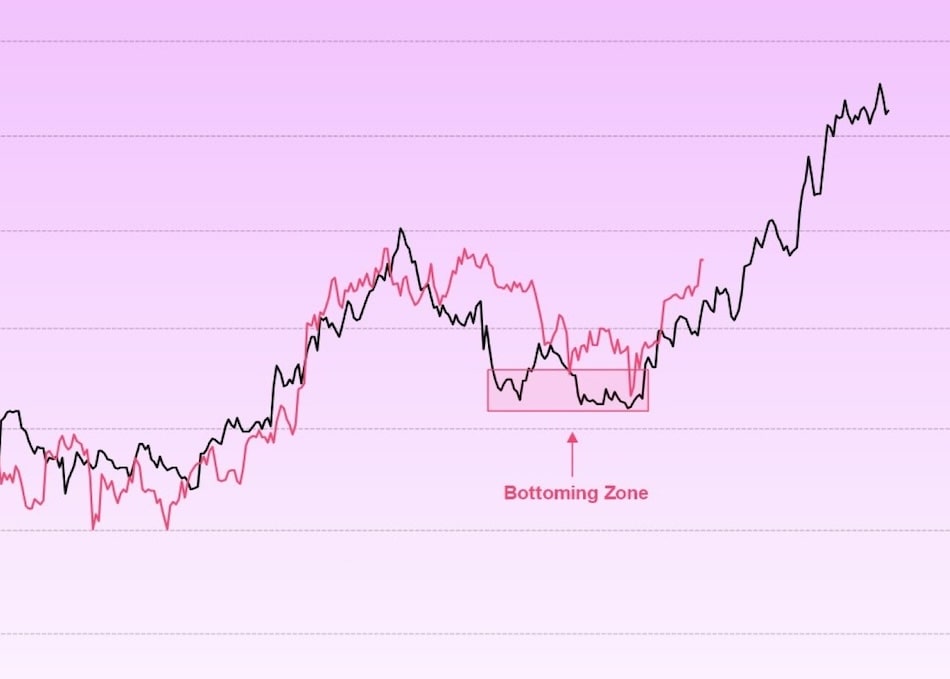
The correlation between the two metrics, which gained traction during the 2021 bull run, has reemerged as a popular reference in 2025.
Expert insights
Julien Bittel, Head of Macro Research at Global Macro Investor, reaffirmed the view, saying the chart…
… still tells the same story: We’re going higher.
M2 money supply trends
M2, a global measure of broad money supply, began rising in February.
When lagged by 90 days, this increase appears to align closely with Bitcoin’s recent price breakout.
A CryptoSlate analysis, however, cautions that the relationship is elastic and more reflective of global liquidity trends than precise price prediction.
Bitcoin’s performance & other influences
Bitcoin has climbed roughly 8% year-to-date, even though the lagged M2 supply has fallen 0.16% during that span.
Over the past 12 months, Bitcoin is up 75%, while lagged M2 is up just 7.37%.
Other factors are also driving the rally.
Bitcoin ETFs saw $1.8 billion in inflows over the past three weeks, including $422 million in a single day led by BlackRock’s IBIT.
Cautionary notes on M2 chart reliance
While the M2 chart may offer a compelling narrative, analysts warn against relying on it as a deterministic trading tool.
Fluctuating correlation values and external macroeconomic variables limit its reliability, even if it remains popular in forums and trading desks.