Disclaimer: Nothing here should be interpreted as altcoin promotion. We focus exclusively on BTC. These charts exist to help view altcoin underperformance vs. BTC.
Bitcoin vs USD1 (USD1)
USD1 Live Price (BTC)₿0.000015
Price in USD
$1.02
Market Cap (USD)
2.20
B
Market Cap (BTC)
32,933
Sats per Coin
1,522
USD1 / BTC Converter
⇄
=
$1.02
Returns Comparison
| Timeframe | USD1 | BTC |
|---|---|---|
| 5 Day | +1.58% | -2.14% |
| 1 Month | +1.59% | -2.14% |
| 3 Month | +1.58% | -28.93% |
| 6 Month | +1.73% | -45.04% |
| YTD | +1.47% | -24.82% |
DCA Comparison
Bitcoin
Return:
-19.43%
Total Value:
$3,222.71
Total Invested:
$4,000.00
Profit/Loss:
$-777.29
USD1
Return:
+1.53%
Total Value:
$4,061.10
Total Invested:
$4,000.00
Profit/Loss:
$61.10
Featured Bitcoin Charts
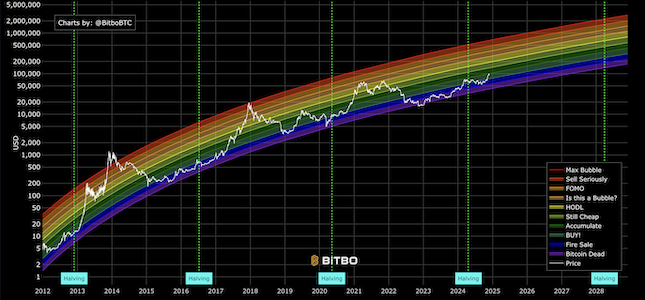
Original Rainbow Chart
The original Bitcoin rainbow price chart showing logarithmic regression bands.

Bitcoin Price Predictions
Shows 4 Bitcoin price models: power law, stock to flow, stock to income, and HPR Rainbow.

RSI
The Relative Strength Index (RSI) is a momentum based visualization.