Disclaimer: Nothing here should be interpreted as altcoin promotion. We focus exclusively on BTC. These charts exist to help view altcoin underperformance vs. BTC.
Bitcoin vs Sonic (S)
S Live Price (BTC)₿0.000001
Price in USD
$0.04
Market Cap (USD)
1.00
B
Market Cap (BTC)
15,056
Sats per Coin
60
S / BTC Converter
⇄
=
$0.04
CAGR Comparison
Compound Annual Growth Rate (CAGR) shows the average yearly return over different time periods.
Select a period to see the annualized return (CAGR) for each asset over that timeframe.
BTC-26.57%
S-92.32%
2025-01-04 → 2026-04-05
Returns Comparison
| Timeframe | S | BTC |
|---|---|---|
| 5 Day | -1.67% | -2.22% |
| 1 Month | +1.05% | -2.22% |
| 3 Month | -58.50% | -29.00% |
| 6 Month | -86.47% | -45.09% |
| YTD | -50.11% | -24.89% |
DCA Comparison
Bitcoin
Return:
-30.04%
Total Value:
$2,798.53
Total Invested:
$4,000.00
Profit/Loss:
$-1,201.47
Sonic
Return:
-85.33%
Total Value:
$586.62
Total Invested:
$4,000.00
Profit/Loss:
$-3,413.38
Historical Performance Comparison
Featured Bitcoin Charts

Bitcoin Fear and Greed Index
Sentiment analysis for Bitcoin & crypto markets, indicating when markets are overly fearful or greedy.

RSI
The Relative Strength Index (RSI) is a momentum based visualization.
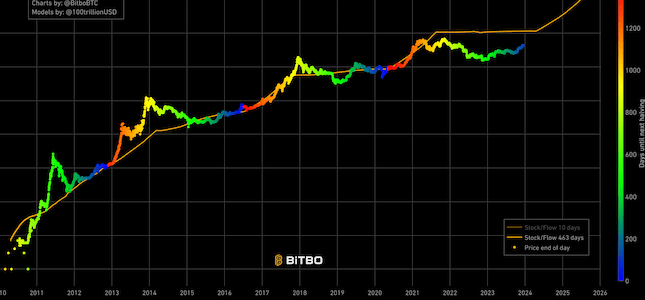
Stock to Flow
Shows the projected Bitcoin price based on the stock to flow model.