Disclaimer: Nothing here should be interpreted as altcoin promotion. We focus exclusively on BTC. These charts exist to help view altcoin underperformance vs. BTC.
Bitcoin vs BNB (BNB)
BNB Live Price (BTC)₿0.008347
Price in USD
$603.93
Market Cap (USD)
94.43
B
Market Cap (BTC)
1,305,162
Sats per Coin
834,685
BNB / BTC Converter
⇄
=
$603.93
CAGR Comparison
Compound Annual Growth Rate (CAGR) shows the average yearly return over different time periods.
Select a period to see the annualized return (CAGR) for each asset over that timeframe.
BTC+4.50%
BNB+7.63%
2021-04-09 → 2026-04-10
Returns Comparison
| Timeframe | BNB | BTC |
|---|---|---|
| 5 Day | +0.33% | +4.92% |
| 1 Month | -7.24% | +3.08% |
| 3 Month | -33.42% | -20.06% |
| 6 Month | -53.53% | -37.13% |
| YTD | -30.09% | -18.53% |
DCA Comparison
Bitcoin
Return:
+48.95%
Total Value:
$5,958.00
Total Invested:
$4,000.00
Profit/Loss:
$1,958.00
BNB
Return:
+40.47%
Total Value:
$5,618.66
Total Invested:
$4,000.00
Profit/Loss:
$1,618.66
Historical Performance Comparison
Featured Bitcoin Charts
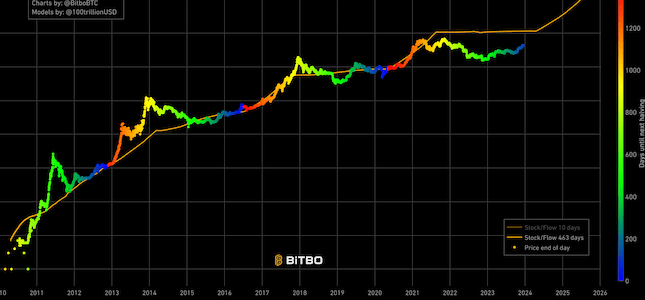
Stock to Flow
Shows the projected Bitcoin price based on the stock to flow model.

Bitcoin Price Predictions
Shows 4 Bitcoin price models: power law, stock to flow, stock to income, and HPR Rainbow.

RSI
The Relative Strength Index (RSI) is a momentum based visualization.